When sudden increases occur in dissolved gases, the procedures recommended in table on Picture 2 in Key Gas Method should be followed. That table is paraphrased from IEEE C57.104-1991. To make it easier to read, the order has been reversed with Condition 1 (lowest risk transformer) at the top and Condition 4 (highest risk) at the bottom. The table indicates the recommended sampling intervals and actions for various levels of TDCG in ppm.
An increasing gas generation rate indicates a problem of increasing severity. Therefore, as the generation rate (ppm/day) increases, a shorter sampling interval is recommended (see table on Picture 2 in Key Gas Method). Some information has been added to the table from IEEE C57-104- 1991. To see the exact table, refer to the IEEE Standard.
If the cause of gassing can be determined and the risk can be assessed, the sampling interval may be extended. For example, if the core is meggered and an additional core ground is found, even though table on Picture 2 in Key Gas Method may recommend a monthly sampling interval, an operator may choose to lengthen the sampling interval, because the source of the gassing and generation rate is known.
A decision should never be made on the basis of just one DGA. It is very easy to contaminate the sample by accidentally exposing it to air. Mislabeling a sample is also a common cause of error. Mislabeling could occur when the sample is taken, or it could be accidentally contaminated or mishandled at the laboratory. Mishandling may allow some gases to escape to the atmosphere and other gases, such as oxygen, nitrogen, and carbon dioxide, to migrate from the atmosphere into the sample. If you notice a transformer problem from the DGA, the first thing to do is take another sample for comparison.
The gas generation chart (Picture 1) and the discussion below represent only an approximate temperature at which gases form. The figure is not drawn to scale and is only for purposes of illustrating temperature relationships, gas types, and quantities. These relationships represent what generally has been proven in controlled laboratory conditions using a mass spectrometer. This chart was used by R.R. Rogers of the Central Electric Generating Board (CEGB) of England to develop the “Rogers Ratio Method” of analyzing transformers.
A vertical band on the left of the chart shows what gases and approximate relative quantities are produced under partial discharge conditions. Note that all the gases are given off, but in much less quantity than hydrogen. It takes only a very low energy event (partial discharge/corona) to cause hydrogen molecules to form from the oil. Gases are formed inside an oil-filled transformer similar to a petroleum refinery still, where various gases begin forming at specific temperatures. From the Gas Generation Chart, we can see relative amounts of gas as well as approximate temperatures. Hydrogen and methane begin to form in small amounts around 150 ºC. Notice from the chart that beyond maximum points, methane (CH4), ethane and ethylene production goes down as temperature increases. At about 250 ºC, production of ethane (C2H6) starts. At about 350 ºC, production of ethylene (C2H4) begins. Acetylene (C2H2) production begins between 500 ºC and 700 ºC. In the past, the presence of only trace amounts of acetylene (C2H2) was considered to indicate that a temperature of at least 700 ºC had occurred; however, recent discoveries have led to the conclusion that a thermal fault (hot spot) of 500 ºC can produce trace amounts (a few ppm). Larger amounts of acetylene can only be produced above 700 ºC by internal arcing. Notice that between 200 ºC and 300 ºC, the production of methane exceeds hydrogen. Starting at about 275 ºC and on up, the production of ethane exceeds methane. At about 450 ºC, hydrogen production exceeds all others until about 750 ºC to 800 ºC, then more acetylene is produced.

Picture 1: Combustible Gas Generation Versus Temperature
It should be noted that small amounts of H2, CH4, and CO are produced by normal aging. Thermal decomposition of oilimpregnated cellulose produces CO, CO2 , H2, CH4, and O2. Decomposition of cellulose insulation begins at only about 100 ºC or less. Therefore, operation of transformers at no more than 90 ºC is imperative. Faults will produce internal “hot spots” of far higher temperatures than these, and the resultant gases show up in the DGA.
Table shown on Picture 1 is a chart of “fault types,” parts of which are paraphrased from the IEC 60599. This chart is not complete. It is impossible to chart every cause and effect due to the extreme complexity of transformers. DGAs must be carefully examined with the idea of determining possible faults and possible courses of action. These decisions are based on judgment and experience and are seldom “cut and dried.” Most professional associations agree that there are two basic fault types, thermal and electrical. The first three on the chart are electrical discharges, and the last three are thermal faults.
Ethane and ethylene are sometimes called “hot metal gases.” When these gases are generated and acetylene is not, the problem found inside the transformer normally involves hot metal. This may include bad contacts on the tap changer or a bad connection somewhere in the circuit, such as a main transformer lead. Stray flux impinging on the tank (such as in Westinghouse 7M series transformers) can cause these “hot metal gases.” Sometimes, a shield becomes loose and falls and becomes ungrounded. Static can then build up and discharge to a grounded surface, producing “hot metal” gases. An unintentional core ground with circulating currents can also produce these gases. There are many other examples.
Notice that both types of faults (thermal and electrical) may be occurring at the same time, and one may cause the other. The ssociations do not mention magnetic faults. However, magnetic faults (such as stray magnetic flux impinging the steel tank or other magnetic structures) also cause hot spots.
Atmospheric Gases
Atmospheric gases (N2, CO2, and O2) can be very valuable in a DGA in revealing a possible leak. However, as mentioned elsewhere, there are other reasons these gases are found in DGAs. Nitrogen may exist from shipping the transformer with N2 inside or from a nitrogen blanket. CO2 and O2 are formed by degradation of cellulose. Be very careful, look at several DGAs and see if atmospheric gases and, possibly, moisture levels are increasing. Also, carefully look at the transformer to see if you can find an oil leak. Moisture and atmospheric gases will leak inside when the transformer is off and the ambient temperature drops.
Dissolved Gas Software
Several companies offer DGA computer software that diagnoses transformer problems. These diagnoses must be used with engineering judgment and should never be taken at face value. The software is constantly changing. The Technical Service Center uses “Transformer Oil Analyst” (TOA) by Delta X Research that uses a composite of several current DGA methods. Dissolved gas analysis help is available from the TSC through the D-8440 and D-8450 groups. Both groups have the above software and experience in diagnosing transformer problems.
One set of rules that TOA uses to generate alarms is based loosely on IEC 60599 (table on Picture 2). These rules are also very useful in daily dissolved gas analysis, which are based on L1 limits of IEC 60599, except for acetylene. IEC 60599 gives a range for L1 limits instead of a specific value. TOA uses the average in this range and then gives the user a “heads up” if a generation rate exceeds 10% of L1 limits per month. Acetylene is the exception; IEEE sets an L1 limit of 35 ppm (too high), and IEC sets an acetylene range of 3 to 50. TOA picks the lowest number (3 ppm) and sets the generation rate alarm value at 3 ppm per month. L1 limits are the quantities at which you should begin to watch the transformer more closely (i.e., the first level of concern).
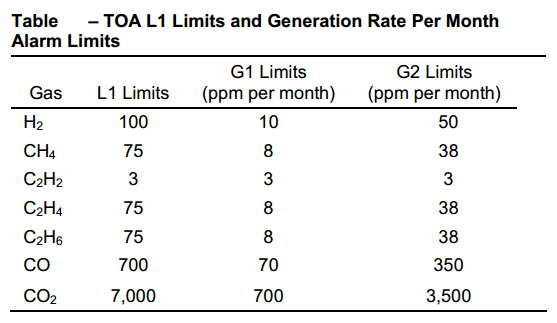
Picture 2: TOA L1 Limits and Generation Rate Per Month Alarm Limits
NOTE: If one or more gas generation rates are equal to or exceed G1 limits (10% of L1 limits per month), you should begin to pay more attention to this transformer. Reduce the DGA sample interval, reduce loading, plan for future outage, contact the manufacturer, etc.
If one or more combustible gas generation rates are equal to or exceed G2 limits (50% of L1 limits per month), this transformer should be considered in critical condition. You may want to reduce sample intervals to monthly or weekly, plan an outage, plan to rebuild or replace the transformer, etc. If an active arc is present (C2H2 generation), or if other heat gases are high (above Condition 4 limits in Key Gas Method), and G2 limits are exceeded, the transformer should be de-energized.
Table shown on Picture 3 is taken from IEC 60599 and contains possible faults and possible findings. This chart is not all inclusive and should be used with other information. Additional possible faults are listed on the following and preceding pages.

Picture 3: Fault Types
Transformers are so complex that it is impossible to put all symptoms and causes into a chart. Several additional transformer problems are listed below. Any of these may generate gases:
- Gases are generated by normal operation and aging, mostly H2 and CO, with some CH4. H2 is the easiest gas to produce except possibly CO. Production of H2 and other gases can be caused by partial discharge (corona), sharp corners on bottom bushing connectors, loose core ground, wet spot on core from gasket leak above, loose corona shield on bottom of bushing, loose tap changer shield, etc. H2 is not very stable when dissolved in oil. Consecutive DGAs may show variation in amounts of H2 and other unstable gases. Acetylene is the most stable gas; variation in amounts of this gas in the upward direction means the transformer has an active arcing fault. If the variation is going up and down within detection limits of the test equipment in consecutive DGAs, this is simply a variation of the lab’s test equipment and personnel.
- Operating transformers at sustained overload will generate combustible gases.
- Problems with cooling systems can cause overheating.
- A blocked oil duct inside the transformer can cause local overheating, generating gases.
- An oil directing baffle loose inside the transformer causes misdirection of cooling oil.
- Oil circulating pump problems (bearing wear, impeller loose or worn, or pump running in reverse) can cause transformer cooling problems.
- Oil level is too low; this will not be obvious if the level indicator is inoperative.
- Sludge in the transformer and cooling system.
- Circulating stray currents may occur in the core, structure, and/or tank.
- An unintentional core ground may cause heating by providing a path for stray currents.
- A hot-spot can be caused by a bad connection in the leads or by a poor contact in the tap changer.
- A hot-spot may also be caused by discharges of static electrical charges that build up on shields or core and structures and that are not properly grounded.
- Hot-spots may be caused by electrical arcing between windings and ground, between windings of different potential, or in areas of different potential on the same winding, due to deteriorated or damaged insulation.
- Windings and insulation can be damaged by faults downstream (through faults), causing large current surges through the windings. Through faults cause extreme magnetic and physical forces that can distort and loosen windings and wedges. The results may be arcing in the transformer, beginning at the time of the fault, or the insulation may be weakened and arcing will develop later.
- Insulation can also be damaged by a voltage surge, such as a nearby lightning strike, switching surge, or closing out of step, which may result in immediate arcing or arcing that develops later.
- Insulation may be deteriorated from age and worn out. Clearances and dielectric strength are reduced, allowing partial discharges and arcing to develop. This can also reduce physical strength, allowing wedging and windings to move extensively during a through-fault, causing total mechanical and electrical failure.
- High noise level (hum due to loose windings or core laminations) can generate gas due to heat from friction. Compare the noise to sister transformers, if possible. Sound level meters are available at the TSC for diagnostic comparison and to establish baseline noise levels for future comparison.
Temperature
Gas production rates increase exponentially with temperature and directly with volume of oil and paper insulation at high enough temperature to produce gases. Temperature decreases as distance from the fault increases. Temperature at the fault center is highest, and oil and paper, here, will produce the most gas. As distance increases from the fault (hot spot), temperature goes down, and the rate of gas generation also goes down. Because of the volume effect, a large heated volume of oil and paper will produce the same amount of gas as a smaller volume at a higher temperature. We cannot tell the difference by looking at the DGA. This is one reason that interpreting DGAs is not an exact science.
Gas Mixing
Concentration of gases in close proximity to an active fault will be higher than in the DGA oil sample. As distance increases from a fault, gas concentrations decrease. Equal mixing of dissolved gases in the total volume of oil depends on time and oil circulation. If there are no pumps to force oil through radiators, complete mixing of gases in the total oil volume takes longer. With pumping and normal loading, complete mixing equilibrium should be reached within 24 hours and will have little effect on DGA if an oil sample is taken 24 hours or more after a problem begins.
Gas Solubility
Solubilities of gases in oil vary with temperature and pressure. Solubility of all transformer gases vary proportionally up and down with pressure. Variation of solubilities with temperature is much more complex. Solubilities of hydrogen, nitrogen, carbon monoxide, and oxygen go up and down proportionally with temperature. Solubilities of carbon dioxide, acetylene, ethylene, and ethane are reversed and vary inversely with temperature changes. As temperature rises, solubilities of these gases go down; and as temperature falls, their solubilities increase. Methane solubility remains almost constant with temperature changes. Table shown on Picture 4 is accurate only at standard temperature and pressure (STP), (0 ºC/32 ºF) and (14.7 psi/29.93 inches of mercury, which is standard barometric pressure at sea level). Table shown on Picture 4 shows only relative differences in how gases dissolve in transformer oil.
Picture 4: Dissolved Gas Solubility in Transformer Oil
From the solubility table (Picture 4) below, comparing hydrogen with a solubility of 7% and acetylene with a solubility of 400%, you can see that transformer oil has a much greater capacity for dissolving acetylene. However, 7% hydrogen by volume represents 70,000 ppm, and 400% acetylene represents 4,000,000 ppm. You probably will never see a DGA with numbers this high. Nitrogen can approach maximum level if there is a pressurized nitrogen blanket above the oil.
Table on Picture 4 shows the maximum amount of each gas that the oil is capable of dissolving at standard temperature and pressure. At these levels, the oil is said to be saturated. If you have conservator-type transformers and nitrogen, oxygen, and CO2 are increasing, there is a good possibility that the tank has a leak or that the oil may have been poorly processed. Check the diaphragm or bladder for leaks and check for oily residue around the pressure relief device and other gasketed openings. There should be fairly low nitrogen and especially low oxygen in a conservator-type transformer. However, if the transformer was shipped new with pressurized nitrogen inside and has not been de-gassed properly, there may be high nitrogen content in the DGA, but the nitrogen level should not be increasing after the transformer has been in service for a few years. When oil is installed in a new transformer, a vacuum is placed on the tank that pulls out nitrogen and pulls in the oil. Oil is free to absorb nitrogen at the oil/gas interface, and some nitrogen may be trapped in the windings, paper insulation, and structure. In this case, nitrogen may be fairly high in the DGAs. However, oxygen should be very low, and nitrogen should not be increasing. It is important to take an oil sample early in the transformer’s service life to establish a baseline DGA; then take samples at least annually. The nitrogen and oxygen can be compared with earlier DGAs. If they increase, it is a good indication of a leak. If the transformer oil has ever been de-gassed, nitrogen and oxygen should be low in the DGA. It is extremely important to keep accurate records over a transformer’s life. When a problem occurs, recorded information helps greatly in troubleshooting.
No comments:
Post a Comment