AC Motors


AC motors are used worldwide in many applications to transform electrical energy into mechanical energy. There are many types of AC motors, but the most common type of motor used in industrial applications are three-phase AC induction motors. An AC motor of this type may be part of a pump or fan or connected to some other form of mechanical equipment such as a winder, conveyor, or mixer (Picture 1).


Picture 1: Winder, Pump, Conveyor


Force and Motion


Before discussing AC motors it is necessary to understand some of the basic terminology associated with motor operation. Many of these terms are familiar to us in some other context.

Force


In simple terms, a force is a push or a pull. Force may be caused by electromagnetism, gravity, or a combination of physical means.
Net force is the vector sum of all forces that act on an object, including friction and gravity. When forces are applied in the same direction, they are added. For example, if two 10 pound forces are applied in the same direction the net force would be 20 pounds. If 10 pounds of force is applied in one direction and 5 pounds of force is applied in the opposite direction, the net force would be 5 pounds and the object would move in the direction of the greater force. If 10 pounds of force is applied equally in both directions, the net force would be zero and the object would not move (Picture 2).


Picture 2: Net force


Torque


Torque is a twisting or turning force that causes an object to rotate. For example, a force applied to the end of a lever causes a turning effect or torque at the pivot point. Torque (τ) is the product of force and radius (lever distance):

τ = Force x Radius

In the English system of measurements, torque is measured in pound-feet (lb-ft) or pound-inches (lb-in). For example, if 10 lbs of force is applied to a lever foot long, the resulting torque is 10 lb-ft. An increase in force or radius results in a corresponding increase in torque. Increasing the radius to two feet, for example, results in 20 lb-ft of torque (Picture 3).


Picture 3: Torque


Speed


An object in motion takes time to travel any distance. Speed is the ratio of the distance traveled and the time it takes to travel:

Speed = Distance / Time

Linear speed is the rate at which an object travels a specified distance. Linear speed is expressed in units of distance divided by units of time, for example, miles per hour or meters per second (m/s). Therefore, if it take 2 seconds to travel 40 meters, the speed is 20 m/s.

Angular (Rotational) Speed


The angular speed of a rotating object determines how long it takes for an object to rotate a specified angular distance. Angular speed is often expressed in revolutions per minute (RPM). For example, an object that makes 10 complete revolutions in one minute, has a speed of 10 RPM.


Acceleration


An object can change speed. An increase in speed is called acceleration. Acceleration occurs only when there is a change in the force acting upon the object. An object can also change from a higher to a lower speed. This is known as deceleration (negative acceleration). A rotating object, for example, can accelerate from 0 RPM to 20 RPM, or decelerate from 20 RPM to 0 RPM.


Inertia


Mechanical systems are subject to the law of inertia. The law of inertia states that an object will tend to remain in its current state of rest or motion unless acted upon by an external force. This property of resistance to acceleration/deceleration is referred to as the moment of inertia. The English system unit of measurement for inertia is pound-feet squared (lb-ft^2). For example, consider a machine that unwinds a large roll of paper (Picture 4). If the roll is not moving, it takes a force to overcome inertia and start the roll in motion. Once moving, it takes a force in the reverse direction to bring the roll to a stop.


Picture 4: Inertia - Paper roller

Any system in motion has losses that drain energy from the system. The law of inertia is still valid, however, because the system will remain in motion at constant speed if energy is added to the system to compensate for the losses.


Friction


Friction occurs when objects contact one another. As we all know, when we try to move one object across the surface of another object, friction increases the force we must apply. Friction is one of the most significant causes of energy loss in a machine.

Work


Whenever a force causes motion, work is accomplished. Work can be calculated simply by multiplying the force that causes the motion times the distance the force is applied:

Work = Force x Distance

Since work is the product of force times the distance applied, work can be expressed in any compound unit of force times distance. For example, in physics, work is commonly expressed in joules. 1 joule is equal to 1 Newton-meter, a force of 1 Newton for a distance of 1 meter. In the English system of measurements, work is often expressed in foot-pounds (ft-lb), where 1 ft-lb equals 1 foot times 1 pound.


Power


Another often used quantity is power. Power is the rate of doing work or the amount of work done in a period of time:

Power = (Force x Distance) / Time = Work / Time


Horsepower


Power can be expressed in foot-pounds per second, but is often expressed in horsepower. This unit was defined in the 18-th century by James Watt. Watt sold steam engines and was asked how many horses one steam engine would replace. He had horses walk around a wheel that would lift a weight (Picture 5). He found that a horse would average about 550 foot-pounds of work per second. Therefore, one horsepower is equal to 550 foot-pounds per second or 33000 foot-pounds per minute.


Picture 5: Horsepower

When applying the concept of horsepower to motors, it is useful to determine the amount of horsepower for a given amount of torque and speed. When torque is expressed in lb-ft and speed is expressed in RPM, the following formula can be used to calculate horsepower (HP):

Power[HP] = Torque[lb-ft] x Speed[RPM] / 5252

Note that an increase in torque, speed, or both increases horsepower.


Horsepower and Kilowatts


AC motors manufactured in the United States are generally rated in horsepower, but motors manufactured in many other countries are generally rated in kilowatts (kW). Fortunately it is easy to convert between these units.

Power[kW] = 0.746 x Power[HP]

For example, a motor rated for 25 HP is equivalent to a motor rated for 18.65 kW. Kilowatts can be converted to horsepower with the following formula:

Power[HP] = 1.34 x Power[kW]

Impact of leading Power Factor loads on Synchronous Alternators


Many electrical loads incorporate elements that can impose a leading power factor on the power source. While these loads are typically not a problem for utility power sources, leading power factor can cause generator set failures or the failure of certain loads to operate properly on a generator set. This article briefly explains the phenomena, and what can be done to address problems when leading power factor loads are present.

The problems seen when attempting to operate generator sets with leading power factor loads may seem mysterious, but in reality, they are not too much different from another energy absorption problem: the limited ability of a generator set to absorb real kW power from loads some elevator drives, and in crane applications. A generator is physically unable to absorb more than a very small amount of real (kW) or reactive (kVAR) power. While the reverse kW power produced by a dropping load in a crane application drove the engine into over-speed conditions when it exceeded the ability of the engine to absorb it, the reverse kVAR load presented by leading power factor devices will drive the alternator into over voltage conditions.
Over the past years, generator set manufacturers have evolved their equipment designs to include use of digital automatic voltage regulator (AVR) equipment, separate excitation systems, and PWM-type control architecture to enable the generator set to produce and stable output voltage and successfully operate non-linear loads. At the same time, manufacturers of equipment that has non-linear load characteristics have begun to commonly employ filters to limit harmonic current distortion induced on the power supply. Capacitive elements are also applied in facilities to improve the power factor when operating on the utility source to avoid higher energy charges. While filters provide positive impacts on the overall power system, they can be very disruptive to generator operation.


Picture 1: Example - no load field required is 17 A, while full load is approximately 38 A


The generator set AVR monitors generator output voltage and controls alternator field strength to maintain constant output voltage. Relatively low AVR output is required to maintain generator voltage at no load. In the Picture 1 shown the no load exciter field current required is less than half the full load level. Filter equipment is often sized for operation at the expected maximum load on the UPS or motor load. At light loads there may be excess filter capacitance, causing a leading power factor. Since rectifiers are commonly designed to ramp on from zero load to minimize load transients, leading power factor loads may be imposed on the system until inductive loads are added to the system or the load factor of the nonlinear load increases.
A utility supply simply absorbs the reactive power output because it is extremely large relative to the filter system and it has many loads that can consume this energy. With a generator set, however, the rising voltage from the leading power factor causes the voltage regulator to turn down and reduce alternator field strength. If the AVR turns all the way off it looses control of system voltage, which can result in sudden large increases in system voltage. The increase in voltage can result in damage to loads, or can cause the loads to fail to operate on the generator set. A UPS is designed to recognize high voltage as an abnormal and undesirable condition, so it can immediately switch off its rectifier. When it does that, the high voltage condition is immediately relieved (because the filter is disconnected from the generator set) and voltage returns to normal. To the observer, the generator will seem to be unable to pick up the system loads.


Paralleling problems


Generator sets that are using in isolated bus paralleling systems have particular issues with leading power factor loads. When loads are applied to a parallel generator bus, the total load on the system can be many times larger than the capacity of a single generator set. The generator sets close to the bus one at a time, so that if high loads (either leading or lagging) are applied before genset capacity is available, the generator bus can fail. With leading power factor loads, the failure mode will be due to either an over voltage condition or reverse kVAR shutdown. due to either an over-voltage condition or due to reverse kVAR shutdown.
Further, there is a tendency, particularly in data center applications, to group UPS loads together on a common bus. This concentrates the leading power factor load on one bus, so that if a large group of UPS load is applied to the first generator set available, it can easily be driven into an excess reverse var condition, which will result in over-voltage and shutdown. If multiple generator sets are on the bus and a large reverse var load is applied to the genset bus, the var load sharing control system can be disrupted, because not all load sharing control systems include logic for reverse kVAR load sharing. If reverse kVAR load sharing is not in the logic for the control system the system will typically cause one or more generator sets to exceed their reverse power limits, which can cause pole slipping.
Generator sets in a paralleling system are maintained in synchronism by their magnetic fields. When a leading power factor load is applied, the voltage of the genset or genset bus rises, and the voltage regulation system of each generator set reduces exciter power, reducing the strength of the magnetic field. If the field is switched off in an attempt to reduce voltage to an acceptable level, the generator set may slip a pole, which results in potentially catastrophic alternator damage.
The reverse kVAR limit of the aggregated generators is the sum of the reverse var limits of each generator. However, the reverse var settings may not be able to take advantage of all the capability of the alternators due to limitations in the VAR load sharing system.


Solutions


What can be done about this? First, we need to understand how much reactive power can be absorbed by the generator without negative impact. The ability of an alternator to absorb power is described by a reactive capability curve. Picture 2 shows a typical generator capability curve describing the capability of a machine to produce and absorb power. In this curve the kVAR produced or absorbed is on the X-axis (positive to the right). The Y-axis shows kW (positive going up). kVAR and kW are shown as per unit quantities based on the rating of the alternator (not necessarily the generator set, which may have a lower rating.
The normal operating range of a generator set is between zero and 100 percent of the kW rating of the alternator (positive) and between 0.8 and 1.0 power factor (green area on curve). The black lines on the curves show the operating range of a specific alternator when operating outside of normal range. Notice that as power factor drops, the machine must be de-rated to prevent overheating. On the left quadrant, you can see that near-normal output (yellow area) can be achieved with some leading power factor load, in this case, down to about 0.97 power factor, leading. At that point, the ability to absorb additional kVAR quickly drops to near zero (red area), indicating that the AVR is “turning off” and any level of reverse kVAR greater than the level shown will cause the machine to lose control of voltage. In other words, if the machine is rated for operation at 1000 kVA and 0.8 power factor (600 kVAR rated), with a reverse kVAR level of 0.2 per unit (rated), you will exceed the machine’s capabilities. So, with more than 120 kVAR reverse reactive power and leading power factor lower than 0.97 (for most people a surprisingly low level) we have a problem.

The ability of a generator set to absorb reactive power is defined by a reverse kVAR limit, not a specific power factor.


Picture 2: Alternator capability curve (Green area is normal operating range of a typical synchronous machine, yellow is abnormal but not damaging, and operating in red regional will cause damage or misoperation)


The solution to this problem on this specific machine involves avoiding excess reverse kVAR levels through proper system design and operation:

• Modify the sequence of operation for the facility so that loads that require reactive power are present on the bus when the UPS ramps on to the generator. The reactive power produced by the filters will be consumed by the system loads, and the loss of voltage control is avoided. This requires a re-thinking of operating sequences in some cases because:
1) perhaps mechanical loads rather than UPS will need to go on the generator first, or
2) loads will be required to be broken into smaller blocks of UPS and mechanical loads, rather than larger isolated buses of each.

• Turn off the filters when operating on the generator set or reduce the magnitude of filtering provided. If the generator is provided with modern digital excitation control, the filters won’t be needed to maintain stable generator operation, but may still be required to properly serve other loads.


The actual limits of reverse kVAR can vary considerably from machine to machine, both within a specific manufacturer’s product line, and between equipment from
different suppliers. A good rule of thumb for equipment is that it can absorb about 20% of its rated kVAR output in reverse kVAR without losing control of voltage. However, since this characteristic is not universal, it is advisable for a system designer to specify the reverse kVAR limit used in his design, or the magnitude of the reverse kVAR load that is expected. Note that this is not specified as a leading power factor limit, but rather as a maximum magnitude of reverse kVAR.
Alternators are physically limited in their ability to both produce and absorb power. When a leading power factor load is applied to an alternator at a site, misoperation of the generator, over-voltage, load misoperation, and alternator damage can occur. There is very little that the alternator supplier can do to resolve problems at a specific site other than to help a system designer understand the nature of the problem and the limits of the machine as installed. Most of the solution will come from changes in the system sequence of operation, or hardware changes that prevent disruptive reverse var conditions from affecting the generator set.


Conclusions and recommendations


>> Synchronous alternators have limited ability to absorb kVAR from load devices, and exceeding this limit will result in generator set shutdown.
>> Paralleling operations require careful consideration of the loading sequence to prevent reverse var conditions that can damage the generator set.
>> Consider modifying system sequence of operation or limiting filter operation until adequate loads are in place to prevent reverse kVAR conditions on the genset.
>> Specify the magnitude of reverse kVAR the genset must be able to absorb, not the power factor alone.
>> In single generator applications protective devices can be set to the limits of the alternator. In paralleling applications both alternator limits and Var load share limits must be considered.


Source: White paper By Gary Olson, Power Systems Development

Estimate of Paper Deterioration


Estimate of Paper Deterioration (Online)


The two methods below should be used together:

CO2 and CO Accumulated Total Gas Values


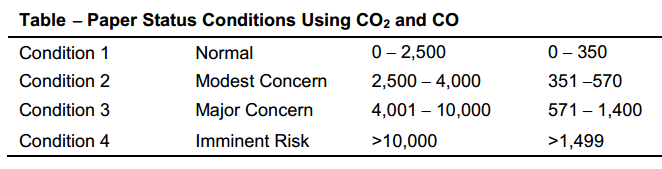
IEEE Standard C57.104™ Guide for the Interpretation of Gases Generated in Oil-Immersed Transformers, gives status conditions, based on accumulated values of CO2 and CO. Accumulated dissolved gas levels provide four status conditions: normal operation, modest concern (investigate), major concern (more investigation), and imminent risk (nearing failure). The CO2 and CO levels in ppm for each status are given in table shown on Picture 1.

CO2 /CO Ratio


The CO2/CO ratio should also be analyzed in conjunction with the CO2 and CO accumulated values.


Picture 1: Paper Status Conditions Using CO2 and CO


CAUTION: The status from table on Picture 1 should be at least in Condition 2 or 3 from one or both gases before a detailed investigation is begun. There is no need to look at the ratios, unless a substantial amount of these gases have already been generated. If the transformer is relatively new, CO2 and other atmospheric gases (N2, O2, and even some CO) may be migrating out of the paper into the oil because the paper was stored in air prior to transformer assembly. If the paper was stored in a polluted city atmosphere, a considerable amount of CO may show up in the DGA. This may look like the transformer has a problem and is generating a lot of CO. However, if the transformer has a real problem, H2 and perhaps other heat gases (CH4, C2H6, C2H4) should also be increasing.


Estimate of Paper Deterioration (Offline During Internal Inspection)


Degree of Polymerization (DP)


Do not open a transformer for the sole purpose of doing this test. Perform this test only if the unit is being opened for other reasons. One of the most dependable means of determining paper deterioration and remaining life is the DP test of the cellulose. The cellulose molecule is made up of a long chain of glucose rings which form the mechanical strength of the molecule and the paper. DP is the average number of these rings in the molecule. As paper ages or deteriorates from heat, acids, oxygen, and water, the number of these rings decreases. When the insulation is new, the DP is typically between 1,000 and 1,400. As paper deteriorates, bonds between the rings begin to break. When the DP reaches around 200, the insulation has reached the end of life. All mechanical strength of the insulation has been lost; the transformer must be replaced.


Process

When doing an internal inspection, or if the transformer is opened and oil is fully or partially drained for any reason on a service-aged transformer, perform a DP test. Remove a sample of the paper insulation about 1 centimeter square from a convenient location near the top of the center phase with a pair of tweezers. In general, in a three-phase transformer, the hottest most thermally aged paper will be at the top of the center phase. If it is not possible to take a sample from the center phase, take a sample from the top of one of the other phases. Send this sample to an oil testing laboratory for the DP test. Analyze results of the DP test with table shown on Picture 2 taken from EPRI’s Guidelines for the Life Extension of Substations (2002 Update, chapter 3). Table on Picture 2 has been developed by EPRI to estimate remaining life.


Picture 2: DP Values for Estimating Remaining Paper Life


Internal Inspection


If an internal inspection is absolutely necessary, it must be completed by an experienced person who knows exactly what to look for and where to look. Many times, more damage is done by opening a transformer and doing an internal inspection than what is gained. There are very few reasons for an internal inspection, some are shown below:

♦ Extensive testing shows serious problems.
♦ Unexplained relay operation takes the transformer offline, and testing is inconclusive.
♦ Acetylene is being generated in the DGA (indicates active internal arcing).
♦ Ethylene and ethane are being generated in sufficient quantities to cause grave concern. This generally indicates a bad connection on a bushing bottom or tap changer, circulating currents, additional core ground, or static discharges.
♦ A core ground must be repaired, or an additional core ground has developed which must be removed.
♦ Vibration and ultrasonic analysis indicate loose windings that are generating gases from heat caused by friction of the vibrating coils. Loose wedges must be located and replaced.
♦ CO2/CO ratio are very low (around 2 or 3), indicating severe paper deterioration from overheating. Cooling must be checked carefully before opening the transformer.
♦ Furans are high, indicating excessive aging rate - a DP test must be completed.
♦ The metal particle count is above 5,000 in 10 milliliters of oil taken specifically for detecting metal particle count.

NOTE: If a service-aged transformer is opened for any reason, a sample of the paper should be taken for DP analysis. If possible, take the paper sample from the top of the center phase winding because this will be near the hot spot. If it is not possible to get a paper sample from the top of B phase, take a sample from the top of one of the other windings.


Transformer Borescope


A new technology has been developed for internal transformer inspections using a specifically designed borescope. The borescope can be used with oil inside the transformer. Core, windings, connections, etc., can be examined and photographed. If it is necessary to go inside the transformer for repairs, workers will possibly know exactly what is defective and exactly what must be done. This technology, used properly, can save generating time and repair dollars.

Ultrasonic and Sonic Fault Detection, Vibration Analysis and Turns Ratio Test


Ultrasonic and Sonic Fault Detection


This test should be performed when hydrogen is increasing markedly in the DGA. High hydrogen generation indicates partial discharge occurring inside the transformer. Other gases such as methane, ethane, and ethylene may also be increasing. Acetylene may also be present, if arcing is occurring, and may also be increasing. Ultrasonic contact (in contact with the tank) fault detection can detect partial discharge (corona) and full discharge (arcing) inside the transformer. This test can also detect loose parts inside the transformer. Partial discharges emit energy in the order of 20 kHz to 200 kHz. These frequencies are above levels that can be audibly detected. The test equipment receives the signals and converts them electronically into audible signals. Headphones are provided to eliminate spurious noise from the power plant and other sources. The equipment logs data for future reference. A baseline test should be conducted and compared with future test data. This test method has some limitations. If a partial discharge is located deep within the windings, external detectors may not be sensitive enough to detect and locate the problem. However, partial discharges most often occur near the top of the transformer in areas of high-voltage stress which can readily be located by this method. These defects can sometimes be easily remedied, extending transformer service life.


Process


Magnetic piezoelectric crystal transducers, sized and tuned to the appropriate frequencies, are placed on the outside of the tank, and signals are recorded. If discharges are detected, the location is triangulated so that, during an internal inspection, the inspector will know the general area to search for a problem. Likewise, sonic (audible ranges) fault detection can find mechanical problems, such as noisy bearings in pumps or fans, nitrogen leaks, loose shields, or other loose parts inside the transformer tank, etc. See also IEEE 62-1995™.


Vibration Analysis


Vibration analysis by itself cannot predict many faults associated with transformers, but it is another useful tool to help determine transformer condition. Vibration can result from loose transformer core segments, loose windings, shield problems, loose parts, or bad bearings on oil cooling pumps or fans. Exercise extreme care in evaluating the source of vibration. Many times, a loose panel cover, door, or bolts/screws lying in control panels, or loose on the outside have been misdiagnosed as problems inside the tank. There are several instruments available from various manufacturers, and the technology is advancing quickly. Every transformer is different, therefore, to detect this, baseline vibration tests should be run and data recorded for comparison with future tests.


Process


For a normal transformer in good condition, vibration data is normally two times line frequency (120 Hz) and also appears as multiples of two times line frequency; that is, four times 60 (240 Hz), six times 60 (360 Hz), etc. The 120 Hz is always the largest and has an amplitude of less than 0.5 inch per second (ips) and greater than 0.1 ips. The next peak of interest is the four times line frequency or 240 Hz. The amplitude of this peak should not exceed 0.5 ips. None of the remaining harmonic peaks should exceed 0.15 ips in amplitude.


Turns Ratio Test


This test only needs to be performed if a problem is suspected from the DGA, Doble testing, or relay operation. The turns ratio test detects shorted turns, which indicate insulation failure by determining if the correct turns ratio exists. Shorted turns may result from short circuits or dielectric (insulation) failures.


Process


Measurements are taken by applying a known low voltage across one winding and measuring the induced-voltage on the corresponding winding. The low voltage is normally applied across a high-voltage winding so that the induced-voltage is lower, reducing hazards while performing the test. The voltage ratio obtained by the test is compared to the nameplate voltage ratio. The ratio obtained from the field test should agree with the factory within 0.5%. New transformers of good quality normally compare to the nameplate within 0.1%.
For three-phase delta/wye or wye/delta connected transformers, a three-phase equivalency test should be performed. The test is performed and calculated across corresponding single windings. Look at the nameplate phasor diagram to find out what winding on the primary corresponds to a particular winding on the secondary. Calculate the ratio of each three-phase winding based on the line to neutral voltage of the wye winding. Divide the line-to-line winding voltage by 1.732 to obtain the correct line-to-neutral voltage. Check the tap changer position to make sure it is set at the position where the nameplate voltage is based. Otherwise, the turns ratio test information cannot be compared with the nameplate. Nameplate information for Reclamation transformers is normally based on the tap three position of the tap changer. See the manufacturer’s instruction manual for the specific turns ratio tester for details. See IEEE 62-1995™.

Visual Inspection of Transformers


Visual inspection of the transformer exterior reveals important condition information. For example, valves positioned incorrectly, plugged radiators, stuck temperature indicator and level gauges, and noisy oil pumps or fans. Oil leaks can often be seen which indicate a potential for oil contamination, loss of insulation, or environmental problems. Physical inspection requires staff experienced in these techniques. There are several required physical inspections that will not be covered here because they were addressed previously. Be sure to inspect the following: winding temperature indicators, pressure relief devices, sudden pressure relay, conservator bladder, conservator breather, and bladder failure relay.


Oil Leaks


Check the entire transformer for oil leaks. Leaks develop due to gaskets wearing out, ultraviolet exposure, taking a “set,” or from expansion and contraction, especially after transformers have cooled, due to thermal shrinkage of gaskets and flanges. Many leaks can be repaired by applying an epoxy or other patch. Flange leaks may be stopped with these methods, using rubberized epoxy forced into the flange under pressure. Very small leaks in welds and tanks may be stopped by peening with a ball-peen hammer, cleaning with the proper solvent, and applying a “patch” of the correct epoxy. Experienced leak mitigation contractors whose work is guaranteed may also be employed. Some leaks may have to be welded. Welding may be performed with oil in the transformer if an experienced, qualified, and knowledgeable welder is available. If welding with oil in the tank is the method chosen, oil samples must be taken for DGA, both before and after welding. Welding may cause gases to appear in the DGA and it must be determined what gases are attributed to welding and which ones to transformer operation.


Oil Pumps


If the transformer has oil pumps, check the flow indicators and pump isolation valves to ensure that oil is circulating properly. Pump motor(s) may also have reversed rotation, and flow indicators may still show that oil is flowing. To ensure motors are turning in the proper direction, use an ammeter to check the motor current. Compare results with the full-load-current indicated on the motor nameplate. If the motor is reversed, the current will be much less than the nameplate full-load-current. Check oil pumps with a vibration analyzer if they develop unusual noises. Have the DGA lab check for dissolved metals in the oil and run a metal particle count for metals, if the bearings are suspect. This should be performed as soon as a bearing becomes suspect. Bad oil pump bearings can put enough metal particles into the oil to threaten transformer insulation and cause flashover inside the tank, resulting in an explosive catastrophic failure of the transformer tank.


Fans and Radiators


Inspect all isolation valves at the tops and bottoms of radiators to ensure they are open. Inspect cooling fans and radiators for cleanliness and fans for proper rotation. Check for dirty or damaged fan blades or partially blocked radiators. Fans are much more efficient if the blades are clean and rotating in cool air. Normally, fans blow cool air through the radiators, they should not be pulling air through. Check to see if fans are reversed electrically (i.e., pulling air first through the radiators and then through the fan blades). This means that the blades are rotating in warm air after it passes through the radiator, which is much less efficient. Place a hand on the radiator opposite the fans, air should be coming out of the radiator against your hand. Watch the blades as they rotate slowly when they are starting or stopping to determine which way they should be rotating and correct the rotation if necessary. See IEEE 62-1995™. Also inspect radiators and fans with an infrared camera.


Age


Transformer age is an important factor to consider when identifying candidates for replacement or rehabilitation. Age is one indicator of remaining life and upgrade potential to current state-of-the art materials. During transformer life, structural strength and insulating properties of materials used for support and electrical insulation (especially paper) deteriorate. Although actual service life varies widely depending on the manufacturer, design, quality of assembly, materials used, maintenance, and operating conditions, the expected life of a transformer is about 40 years.


Infrared Temperature Analysis


Infrared analysis should be conducted annually while equipment is energized and under full load, if possible. IR analysis should also be conducted after any maintenance or testing to see if connections that were broken were re-made properly. Also, if IR is performed during factory heat run, the results can be used as a baseline for later comparison.


IR for Transformer Tanks


Unusually high external temperatures or unusual thermal patterns of transformer tanks indicate problems inside the transformer, such as low oil level, circulating stray currents, blocked cooling, loose shields, tap changer problems, etc. Infrared scanning and analysis is required annually for trending purposes by National Fire Protection Association. See also IEEE 62-1995™. Abnormally high temperatures can damage or destroy transformer insulation and, thus, reduce life expectancy. Thermal patterns of transformer tanks and radiators should be cooler at the bottom and gradually warmer ascending to the top. See Picture 1 for a normal pattern; the red spot at the top is normal showing a “hot spot” top of B phase, about 110 degrees Fahrenheit (°F). Any departure from this pattern means a probable problem which must be investigated. An IR inspection can find over-heating conditions or incorrect thermal patterns. IR scanning and analysis requires trained staff, experienced in these techniques.


Picture 1: Normal Transformer IR Pattern


IR for Surge Arresters


Surge arresters should be included when infrared scanning energized transformers. Look for unusual thermal patterns on the surface of lightning arresters (see the arrester IR image in Picture 2). Note that the yellow in the top right of the image is a reflection not associated with the arrester. A temperature profile of the arrester is shown as black lines. Note the hot spot (yellow) about a third of the way down from the top. This indicates that immediate de-energization and replacement must be undertaken. Catastrophic failure is imminent which can destroy nearby equipment and be hazardous to workers. Also compare thermal patterns to sister units or earlier scans of the same arrester. Scan all high-voltage connections and compare them to nearby connections for unusual temperatures.


Picture 2: IR Image of Defective Arrester


IR for Bushings


IR scans of bushings can show low oil levels which would call for immediate de-energization and replacement. This generally means that the seal in the bushing bottom has failed, leaking oil into the transformer. The top seal has probably also failed, allowing air and up the bushing. Another reason a bushing can exhibit a high oil level is that the top seal is leaking, allowing water to enter. The water migrates to the bushing bottom, displacing the oil upward. Remember, over 90% of bushing failures are attributed to water entrance through the top seal. Bushings commonly fail catastrophically, many times destroying the host transformer or breaker and nearby equipment and causing hazards to workers. Picture 3 shows low-oil level in a high-voltage transformer bushing. Compare previous IR scans of the same bushing with the current scan. Doble hot-collar testing possibly may show this problem. However, Doble tests are run infrequently, and the transformer has to be out of service, under clearance, and both primary and secondary conductors removed, while an IR scan easily can be performed at any time.


Picture 3: IR Image of Defective Bushing


IR for Radiators and Cooling Systems


Examine radiators with an IR camera and compare them with each other. A cool radiator or segment indicates that a valve is closed or the radiator or segment is plugged. The IR image (Picture 4) shows that the cold left radiator section is valved off or plugged. If visual inspection shows the valves are open, the radiator or segment must be isolated, drained, removed, and the blockage cleared. Do not allow a transformer to operate with reduced cooling which drastically shortens transformer life. Remember, an increased operating temperature of only 8 to 10 °C will reduce transformer life by one-half. IR scan all cooling systems, including heat exchangers, fans, pumps, motors, etc. Check inside control panels for overloaded wiring, loose connections, and overheated relays. Look for unusual thermal patterns and compare similar equipment.


Picture 4: IR Image Showing Blocked Radiators


Corona Scope Scan


With the transformer energized, scan the bushings and surge arresters and all high-voltage connections for unusual corona patterns. Corona should be visible only at the top of bushings and arresters, and corona at connections should be similar to sister connections. As a bushing deteriorates due to physical defects, the corona pattern will grow progressively larger. When the corona pattern reaches a grounded surface (i.e., the tank or structure), a flashover will occur, destroying the bushing or arrester and, perhaps, the transformer. The corona scope will reveal this problem long before a flashover.

Sweep Frequency Response Analysis (SFRA) Tests


These tests show, in trace form, the winding transfer function of the transformer and are valuable to determine if any damage has occurred during shipping or during a through fault. Core grounds, core displacement, and other core and winding problems can be revealed by this test. These tests should be conducted before and after the transformer has been moved or after experiencing a through fault. Results should be compared to baseline tests performed at the factory or as soon as possible after receiving the transformer. If the SFRA tests cannot be performed at the factory, they should be conducted as an acceptance test before energizing a new or rebuilt transformer to establish a baseline. A baseline should be established for older inservice transformers during a normal Doble test cycle. If possible, one should use the same test equipment for baseline and following tests, or the results may not be comparable.

CAUTION: Do not attempt to run a sweep frequency response analysis test immediately after any DC test. Energizing with DC will leave a residual magnetism in the core and will offset the results of the SFRA test.

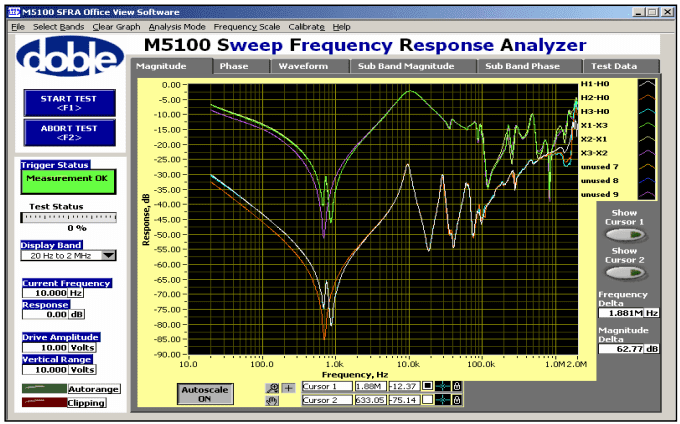
For a delta/wye transformer, a test voltage of variable frequency (normally 20 hertz [Hz] to 2 megahertz [MHz]) is placed across each phase of the high-voltage winding. With this set of tests, low-voltage windings are isolated with no connections on any of the bushings. An additional set of tests is performed by short circuiting all the low-voltage windings and again placing the test voltage on each phase of the high-voltage winding. A third set of tests is made by isolating the high-voltage winding and placing the test voltage across each low-voltage winding. See the M5100 SFRA Instrument Users Guide, Doble Engineering Company for connection details. Picture 1 shows test traces on a new three-phase transformer. The top three traces were taken on the low-voltage side: X1-X3, X2-X1, and X3-X2. The two outside windings (A and C phases) have the same general shape with a “W” at the lowest point of the trace, while the inside winding (B phase) has a “V” at the bottom. The high-voltage traces (lower three) have the same characteristics. Note that, in both high- and low-voltage tests, the traces fall almost perfectly on top of each other for the outside windings (A and C), while the inside winding (B phase), is slightly displaced to the left. These are characteristic traces of a three-phase transformer in good condition. These traces will be the baseline for future tests on this transformer.


Picture 1: SFRA Test Traces of a New Transformer


By comparing future traces with baseline traces, the following can be noted. In general, the traces will change shape and be distorted in the low frequency range (under 5,000 Hz) if there is a core problem. The traces will be distorted and change shape in higher frequencies (above 10,000 Hz) if there is a winding problem. Changes of less than 3 decibels (dB) compared to baseline traces are normal and within tolerances. From 5 Hz to 2 kilohertz (kHz), changes of + or – 3 dB (or more) can indicate shorted turns, open circuit, residual magnetism, or core movement. From 50 Hz to 20 kHz +/- 3 dB (or more), a change from baseline can indicate bulk movement of windings relative to each other. From 500 Hz to 2 MHz, changes of +/- 3 dB (or more) can indicate deformation within a winding. From 25 Hz to 10 MHz, changes of +/- 3 dB (or more) can indicate problems with winding leads and/or test leads placement. The above diagnostics come from the Euro-Doble Client Committee after much testing experience and analysis. Note that there is a great deal of overlap in frequencies, which can mean more than one diagnosis.


Picture 2: SFRA Test Traces of a Defective Transformer


Picture 2 shows traces of a transformer with a problem. This transformer test results are used for illustration only. The traces have the same general positions on the graph as the good transformer. The lower traces are high-voltage winding tests, while the upper traces are the low-voltage winding tests. Note in the higher frequencies of the low-voltage traces that “A” phase (X1-X0 green trace) is displaced from the other two phases more than 3 dB from about 4 kHz to about 50 kHz. With a healthy transformer, these would fall almost on top of each other as the other two phases do. Also notice that “A” phase (H1-H3 Lsh) is displaced in the test with the low-voltage winding shorted. There is an obvious problem with “A” phase on the low-voltage side. After opening the transformer, it was found that the “A” phase winding lead had burned off near the winding connection and re-welded itself on the winding at a different location, effectively shorting out a few turns. The transformer was still working, but hot metal gases (ethylene, ethane, methane) were actively generating and showing up in the DGA. Although other tests could have revealed this problem, SFRA showed the problem was with “A” phase and, therefore, where to concentrate the internal inspection.

Transformer Testing


Transformer testing falls into three broad categories: factory testing when the transformer is new or has been refurbished, acceptance testing upon delivery, and field testing for maintenance and diagnostic purposes. Some tests at the factory are common to most power transformers, but many of the factory tests are transformer-specific. Not all of the tests are performed at the factory, and not all of them are performed in the field. Each transformer and each situation is different, requiring its own unique approach and tests.


DC Winding Resistance Measurement


If generation of ethylene, ethane, and perhaps methane in the DGAs indicates a poor connection, winding resistances should be checked. Turns ratio, sweep frequency response analysis (SFRA), Doble tests, or relay operations may give indications that dc testing is warranted. Winding resistances are tested in the field to check for loose connections on bushings or tap changers, broken strands, and high contact resistance in tap changers. Results are compared to other phases in wye-connected transformers or between pairs of terminals on a delta-connected winding to determine if a resistance is too high. Resistances can also be compared to the original factory measurements or to sister transformers. Agreement within 5% for any of the above comparisons is considered satisfactory. If winding resistances are to be compared to factory values, resistance measurements will have to be converted to the reference temperature used at the factory (usually 75 °C). To do this, use the following formula:

Rs = Rm * (Ts + Tk)/(Tm + Tk)

Rs = Resistance at the factory reference temperature (found in the transformer manual);
Rm = Resistance you actually measured;
Ts = Factory reference temperature (usually 75 ºC);
Tm = Temperature at which you took the measurements;
Tk = Constant for the particular metal the winding is made from: 234.5 ºC for copper, 225 ºC for aluminum.


It is very difficult to determine actual winding temperature in the field, and, normally, this is not needed. The above temperature corrections are necessary only if resistance is to be compared to factory values. Normally, phase resistances are compared to each other or to sister transformers at the same temperature, and actual winding temperatures and corrections are not needed. Compare winding resistances to factory values; change in these values can reveal serious problems. A suggested method to obtain an accurate temperature is outlined below. If a transformer has just been de-energized for testing, the winding will be cooler on the bottom than the top, and the winding hot spot will be hotter than the top oil temperature. The average winding temperature is needed, and it is important to get the temperature as accurate as possible for comparisons.

CAUTION: Do not attempt to run an excitation current test immediately after any direct current (DC) test. Energizing with dc will leave a residual magnetism in the core and will ruin the results of the excitation current test.

The most accurate method is to allow the transformer to sit deenergized until temperatures are equalized. This test can reveal serious problems, so it’s worth the effort. Winding resistances are measured using a Wheatstone Bridge for values of 1 ohm or above and using a micro-ohmmeter or Kelvin Bridge for values under 1 ohm. A multi-amp (now AVO) makes a good instrument for these measurements, which is quick and easy to use. Take readings from the top of each bushing to neutral for wye-connected windings and across each pair of bushings for deltaconnected windings. If the neutral bushing is not available on wyeconnected windings, take each one to ground (if the neutral is grounded) or take readings between pairs of bushings as if it were a delta winding. Be consistent each time so that a proper comparison can be made. The tap changer can also be changed from contact to contact, and the contact resistance can be checked. Make sure to take the first test with the tap changer “as found.” Keep accurate records and connection diagrams so that later measurements can be compared.


Core Insulation Resistance and Inadvertent Core Ground Test (Megger®)


Core insulation resistance and core ground test is used if an unintentional core ground is suspected; this may be indicated by the DGA. Key gases to look for are ethane and/or ethylene and possibly methane. These gases may also be present if there is a poor connection at the bottom of a bushing or a bad tap changer contact.

CAUTION: Do not attempt to run excitation or SFRA tests on a transformer immediately after using dc test equipment. Residual magnetism will remain in the core and ruin the excitation current and SFRA test results.

Therefore, this test is only necessary if the winding resistance test shows all connections and tap changer contacts in good condition. The intentional core ground must be disconnected. This may be difficult, and some oil may have to be drained to accomplish this. On some transformers, core grounds are brought outside through insulated bushings and are easily accessed. A standard dc Megger® (1,000-volt Megger® is recommended) is then attached between the core ground lead (or the top of the core itself and the tank [ground]). The Megger® is used to place a dc voltage between these points, and the resistance is measured. A new transformer should read greater than 1,000 megohms. A service-aged transformer should read greater than 100 megohms. Ten to one-hundred megohms is indicative of deteriorating insulation between the core and ground. Less than 10 megohms is sufficient to cause destructive circulating currents and must be further investigated. A solid, unintentional core ground may read zero ohms; this, of course, causes destructive circulating currents and must be corrected before energization. Some limited success has been obtained in “burning off” unintentional core grounds using a dc or ac current source. This is a risky operation, and the current may cause additional damage. The current source is normally limited to a maximum of 40 to 50 amps and should be increased slowly to use as little current as possible to accomplish the task. This should only be used as a last resort and then only with consultation from the manufacturer, if possible, and with others experienced in this task.

CAUTION: This will generate gases which will be dissolved in the oil and will show up in the DGA! Take a sample for DGA with in 72 hours after burning off the unintentional core ground and compare this DGA with the prior one to determine what gases were created by this task.


Doble Tests on Insulation


Doble testing is important to determine the condition of a transformer, because it can detect winding and bushing insulation integrity and problems in the winding and core. Doble tests are conducted in the field on de-energized transformers using special test equipment. Generally, a Doble M-4000 test set is used along with accompanying software. The software automatically performs analysis of test results and responds with a four letter code: G = Good, I = Investigate, D = Deteriorated, and B = Bad. These codes refer to insulation quality. If a “D” or “B” code is encountered, the insulation should be re-tested, carefully investigated, and the problem explained before re-energizing. Other tests may have to be performed; and, perhaps, an internal inspection should be considered before the unit is re-energized. The Doble Company should be consulted, along with the transformer manufacturer, and other transformer experts. If the problem is severe, the unit may have to be taken out of service.

Insulation Power Factor Test


The purpose of this test is to determine the state of dryness of the windings and insulation system and to determine a power factor for the overall insulation, including bushings, oil, and windings. It is a measure of the ratio of the power (I2R) losses to the voltamperes applied during the test. The power factor obtained is a measure of watts lost in the total transformer insulation system, including the bushings. The power factor should not exceed 0.5% at 20 EC. Temperature correction of test results can be performed automatically on the Doble test set. The watts lost should not exceed one-half of one percent of the total power input (voltamperes) from the test. The values obtained at each test are compared to previous tests and baseline factory tests, and a trend can be established as the insulation system ages.

Capacitance Test


This test measures and records the capacitance (including bushings) between the high and low-voltage windings, between the high-voltage winding and the tank (ground), and between the low-voltage winding and the tank (ground). Changes in these values as the transformer ages and events occur, such as nearby lightning strikes or through faults, indicate winding deformation and structural problems, such as displaced wedging and winding support.

Excitation Current Test


The purpose of this test is to detect short-circuited turns, poor electrical connections, core de-laminations, core lamination shorts, tap changer problems, and other possible core and winding problems. On three-phase transformers, results are also compared between phases. This test measures current needed to magnetize the core and generate the magnetic field in the windings. Doble software only gives two indications on this test: “G” for good and “Q” for questionable. On a three-phase, wye/delta or delta/wye transformer test, the excitation current pattern will be two phases higher than the remaining phase. Compare the two higher currents only. If the excitation current is less than 50 milliamps (mA), the difference between the two higher currents should be less than 10%. If the excitation current is more than 50 mA, the difference should be less than 5%. In general, if there is an internal problem, these differences will be greater. When this happens, other tests should also show abnormalities, and an internal inspection should be considered. The results, as with all others, should be compared with factory and prior field tests.

CAUTION: Perform the excitation test before any DC tests. Excitation current tests should never be conducted after a DC test has been performed on the transformer. Results will be incorrect because of residual magnetism of the core left from the DC tests.


Bushing Tests


For bushings that have a potential tap, both the capacitance between the top of the bushing and the bottom tap (normally called C1), and the capacitance between the tap and ground (normally called C2) are measured. To determine bushing losses, power factor tests are also performed. C2 capacitance is much greater than C1. Bushings without a potential tap are normally tested from the bushing top conductor to ground and Ahot collar@ tests. These test results are compared with factory tests and/or prior tests to determine deterioration. About 90% of bushing failures may be attributed to moisture ingress, evidenced by an increasing power factor from Doble testing on a scheduled basis.


Percent Impedance/Leakage Reactance Test


This is normally an acceptance test to see that nameplate percent impedance agrees with the measured percent impedance when the transformer arrives onsite. Normally, a 3% difference is considered acceptable. However, after the initial benchmark test, the percent impedance should not vary more than 2% from benchmark. As the transformer ages or suffers events such as through faults, nearby lightning strikes, and other surges, this test is used in the field to detect winding deformation. Winding deformation can lead to immediate transformer failure after a severe through fault, or a small deformation can lead to a failure years later.
Percent impedance/leakage reactance testing is performed by short circuiting the low-voltage winding and applying a test voltage to the high-voltage winding. Reluctance is resistance to lines of magnetic flux. Reluctance to the magnetic flux is very high in spaces between the high- and low-voltage windings and spaces between the windings and core. Reluctance is very low through the magnetic core so that the vast majority of total reluctance is in the spaces. When winding movement (distortion) occurs, these spaces change. Therefore, the reluctance changes, resulting in a change in the measured leakage reactance. Changes in leakage reactance and in capacitance tests serve as an excellent indicator of winding movement and structural problems (displaced wedging, etc.). This test does not replace excitation current tests or capacitance tests but complement them, and they are used together. The excitation current test relies on reluctance of the core while the leakage reactance test relies on reluctance of the spaces. See Doble’s Leakage Reactance Instrument Users Guide, and IEEE®, Guide for Diagnostic Field Testing of Electric Power Apparatus-Part 1: Oil-Filled Power Transformers, Regulators, and Reactors (IEEE 62-1995™).